The first step in Tactical Risk Management is to
determine and prioritize the risks that an operation faces. This is
a critical step to the success of the entire process. Through the use of
the techniques in this step the strategic risk management process, or
SRMP, will enable a producer to identify, quantify, organize and
prioritize risks, ultimately leading to the ability to discern what
risks threaten the operation. In order to identify risks faced by an
operation, five specific sources of risk in production agriculture have
been determined. Most risks faced by an operation fit into one of the
categories:
| Production Risk –
|
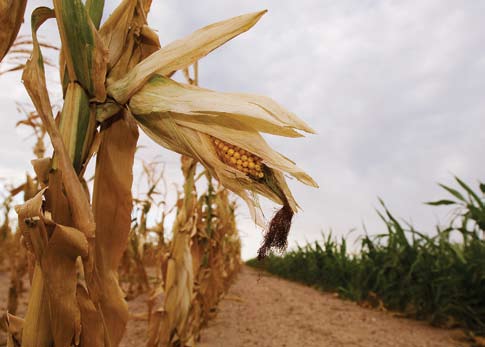
Uncontrollable events such as weather, pests, or disease
that make crop or livestock yields unpredictable. |
| Market or Price
Risk – |
The changing of prices for outputs and/or inputs as a result
of domestic and international supply and demand relations
occurring after the producer commits to a production plan. |
| Financial Risk – |
Risks associated with the attainment of capital to operate
an agricultural business throughout the biologically lagged
production cycle. |
| Institutional Risk
– |
Unpredictable changes in policies and regulations, often
governmental, which can affect the profitability of an
agricultural operation. |
| Human Resource
Risk – |
Risk introduced through unforeseen changes in the character,
health, or behavior of people involved in the agricultural
operation. |
Using the SRMP tools to determine and prioritize risks, a producer
will learn these definitions as well as be trained on how to categorize
a risk into one of the five categories.
Most of the risks faced by agricultural producers are very
 complicated. Therefore, it is only the beginning of the step to
determine what risks are faced by the operation. After the sources of
risk are identified, it is important to prioritize the risks with
respect to the particular operation. This can be accomplished in many
ways. Two tools that SRMP uses to help prioritize sources of risk are
the Influence Diagram and the Risk-Influence Chart.
An Influence Diagram is a graphical representation of the risk being
analyzed. It provides some structure to analyzing risk management
decisions that are often complex and circuitous. One particular type of
Influence Diagram used in the SRMP is the Contributing Factor Diagram
(CFD). Instead of attempting to capture all of the relationships
inherent in a risk situation, the CFD focuses on the logical or most
important relationships in a decision.
Risk-Influence charts can be used to finish prioritizing risks. The
idea behind the Risk-Influence chart is straight forward: risks can be
prioritized through the evaluation of how much a particular risk impacts
a particular operation as well as how much a particular operation can
influence that risk. Once a producer has determined the sources of risk
that the operation is exposed to, priority can be given to the risks
that are high and that can be highly influenced by the operation. On the
other hand, decisions that entail low risk and low influence by the
operation can be given lower priority.
Through determining and prioritizing risks, the operation will create
a type of roadmap for the rest of the tactical steps that will allow for
efficient strategic risk management at the farm level.

