In Step 6, we calculate the probability of each
possible outcome for every management action under consideration.
Few people really understand probability, but the SRMP can help.
Fortunately, there are some well established concepts and tools
available to aid the decision-maker in
 putting this all together. The SRMP uses your historical data, or even
just your judgment if information is not available, to produce a
graphical representation of likelihood (or probability) in the form of a
histogram, a probability density function, or a cumulative density
function. These graphical pictures are among the tools that can be used
by the decision-maker to estimate the likelihood of an outcome
occurring.
putting this all together. The SRMP uses your historical data, or even
just your judgment if information is not available, to produce a
graphical representation of likelihood (or probability) in the form of a
histogram, a probability density function, or a cumulative density
function. These graphical pictures are among the tools that can be used
by the decision-maker to estimate the likelihood of an outcome
occurring.
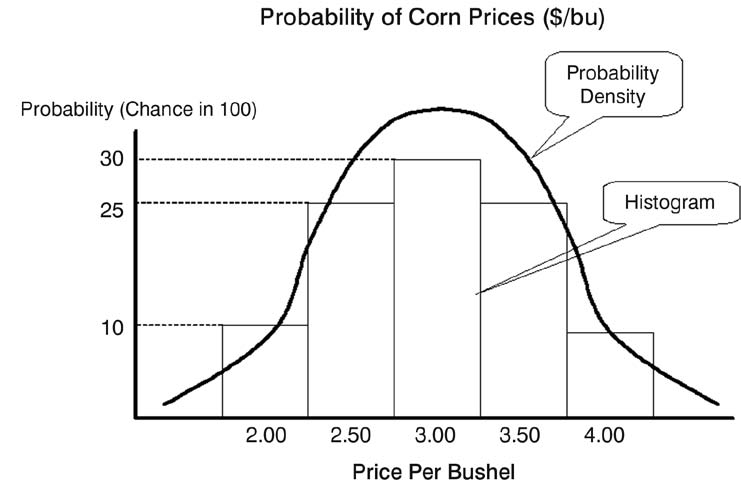 The diagram shows a histogram of corn price probabilities and the
familiar bell-shaped probability density function. The chance of the
price being $3/bushel is 30 percent. This is three times more likely
than the price being $2/bushel, which is 10 percent. Real-life
probabilities do not usually behave so well; they are usually a lot more
bumpy and asymmetrical. With the help of the SRMP, you can trace out the
probabilities for your own crop yields, prices, or most anything else.
The diagram shows a histogram of corn price probabilities and the
familiar bell-shaped probability density function. The chance of the
price being $3/bushel is 30 percent. This is three times more likely
than the price being $2/bushel, which is 10 percent. Real-life
probabilities do not usually behave so well; they are usually a lot more
bumpy and asymmetrical. With the help of the SRMP, you can trace out the
probabilities for your own crop yields, prices, or most anything else.
